Daily air quality index of some of the world's major cities on July 2, using data from AirNow, CITEAIR, and the American Embassy in Beijing.
City
| Average 29/06/2012 | Average 02/07/2012 |
London
| ||
| Madrid | ||
Paris
| ||
Brussels
| ||
Berlin
| ||
Prague
| ||
Zurich
| ||
| Beijing | NA | NA |
| Beijing US embassy stats | NA | |
| Shanghai | ||
Hong Kong
| ||
| Brunei | ||
| Seoul | NA | |
New York
| ||
San Francisco
| ||
| Mexico City | ||
Montreal
| NA | NA |
Toronto
| NA | NA |
| New Delhi | ||
| Sydney |
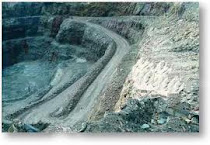
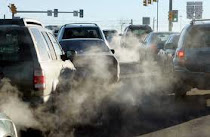
The Air Quality Index (AQI) or Air Pollution Index (API) measures the parts of pollutant in a specified volume of air. The lower the AQI the fewer particles of pollution are in the air. For a more detailed explanation see http://www.airnow.gov/index.cfm?action=aqibasics.aqi.
All results are color-coded following the American AQI standard shown below. For all countries outside of Europe, the US and Canada, that region's definition of AQI terms has been accepted.
Legend
Legend
Air Quality
| |
Good
| |
Moderate
| |
Unhealthy for sensitive groups
| |
Unhealthy
| |
Very Unhealthy
| |
| Hazardous |
Data: Data relating to Europe, the US and Canada is taken from CITEAIR -- Common Information to European Air (http://www.airnow.gov / http://www.airqualitynow.eu); data concerning China is taken from both official Chinese government sources and the US Embassy's automated air index Twitter account. For all countries the data displayed falls within either that country's definition of the level of air quality or the international AQI index. Data for all European, US and Canadian cities refers to background, not roadside, levels of air quality.
Data for Beijing is taken from an average reading given across six districts by the Beijing Municipal Environmental Monitoring Center.
All data was collected at 08:45 am GMT on July 02.
All data was collected at 08:45 am GMT on July 02.